
Using the Script
Once the script is installed, you can run the script from the location chosen during installation. When you launch the script, a basic UI will load with a few simple features. For a summarized explanation, tool tips will appear when hovering the mouse cursor over the UI buttons.
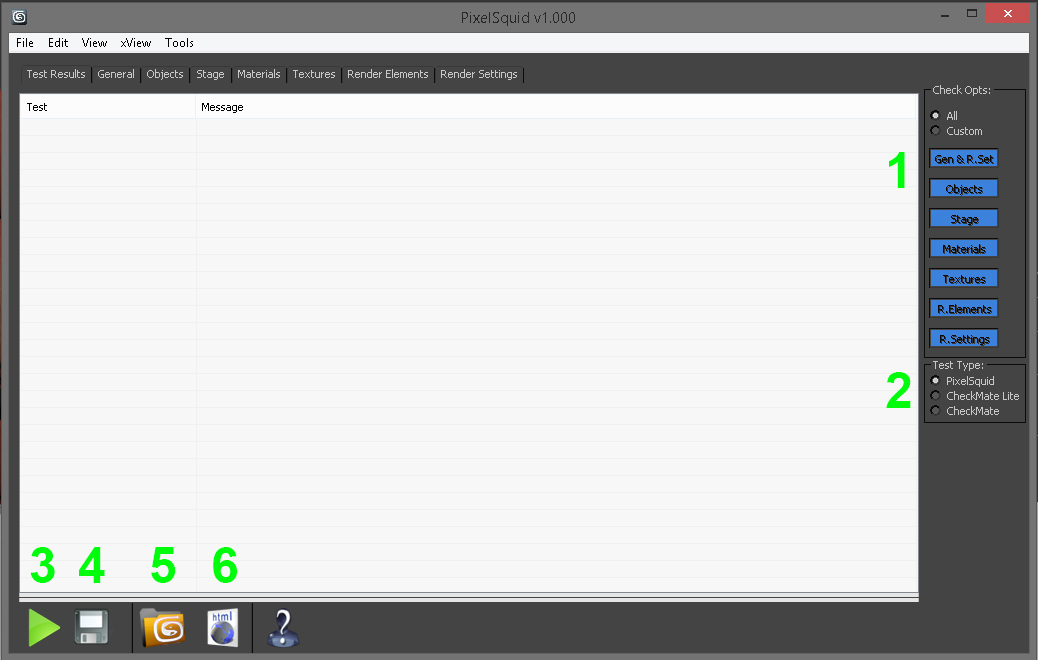
1. Check Options
By Default, the tool will inspect all aspects of the scene. In selecting Custom, each test can be run individually or with any combination desired. As some tests can take a long time to run depending on the contents of your scene, we suggest that after an initial test with all options, you only run individual tests that failed. But, a final run on all tests befor submitting is suggested.
2. Test Type
Choose the test type based on which specification you are submitting for in order to filter the tests. It is defaulted for PixelSquid , but the Inspector tool can also be used to help with the different CheckMate certifications.
3. Run Tests
Clicking on the Play arrow will begin to process the scene for all selected Check Options.
4. Save Tests HTML Report
Use this button to save an HTML file of the tool’s test results (made for easy viewing, without having to test again).
5. Open Current Scene Folder
Opens directory to location of Max file in use.
6. Open Last Saved HTML File
Click to open the most recently-saved HTML report.
Inspection Report
Once the script has been run, the results will display with categorization and color coding. Each tab displays test results for that category. You can right click an object name in the Object test results to quickly select that object. These reports are to aid in finding errors that need correction in the scene.
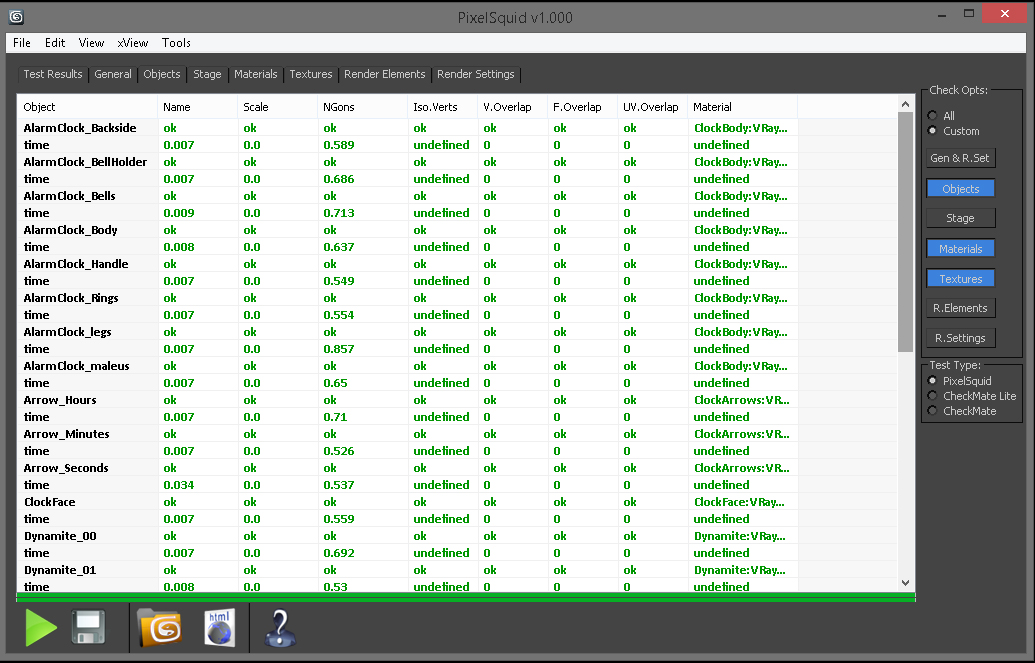
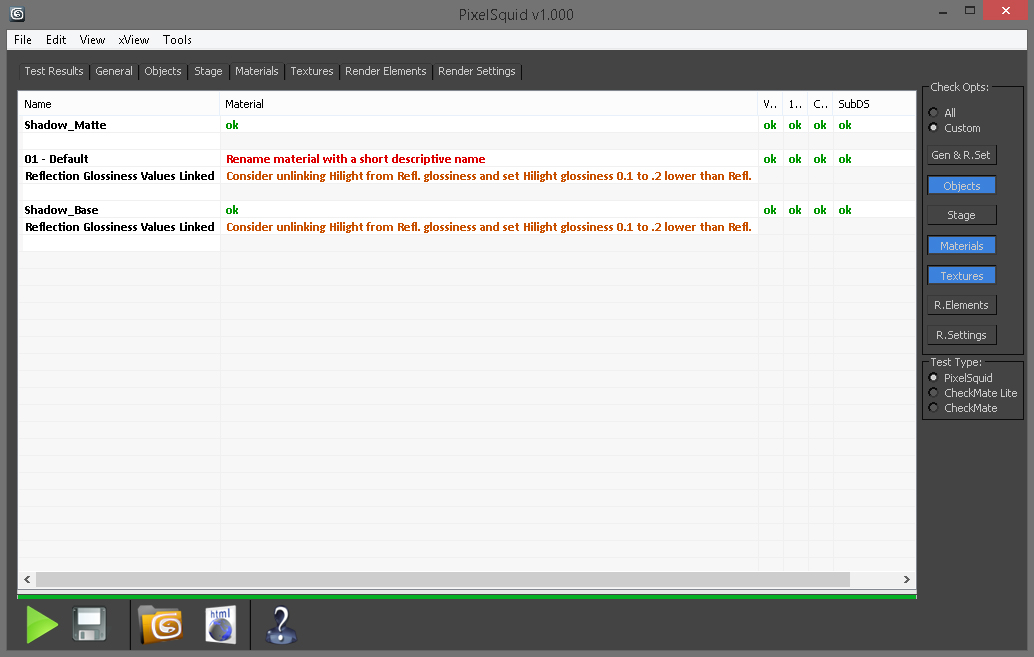
Green
Indicates passing.
Yellow Green
Represents warnings or suggestions for problems that may be present.
Red
Indicates failing a check.